TroubleshootingGuide
Local LLM out of VRAM? See weights vs KV cache with gputaskman
Find what fills your GPU memory when an Ollama or llama.cpp model fails or slows down, which setting to change, and when an API is simpler.
On this page
Your local model loaded fine yesterday, today it crashes on load or crawls, and the only thing you changed was the context length. A common culprit is the KV cache, and a free terminal tool called gputaskman can show you that instead of leaving you to guess.
A typical GPU monitor tells you how full VRAM is. That's the "what", not the "why". gputaskman's README (checked 5 November 2026) calls itself "An htop for what's inside your GPU, not just how full it is." It is an early, experimental, MIT-licensed project, so treat it as a handy lens, not a verdict.
What actually fills your VRAM#
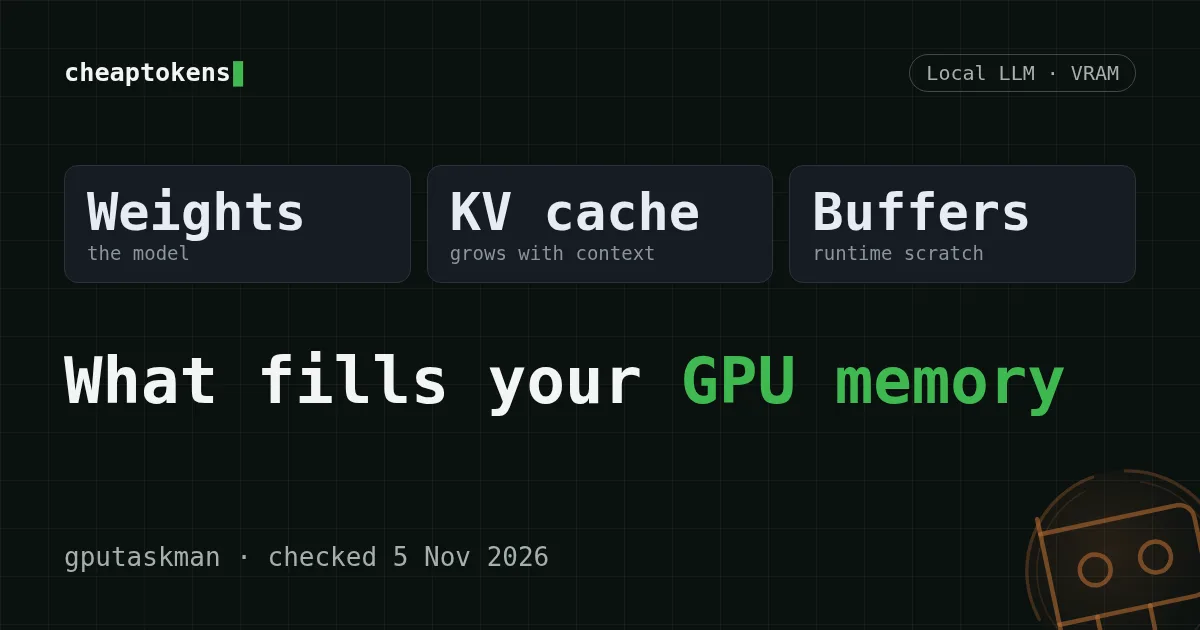
Think of VRAM as a suitcase. Three things go in:
- Weights: the model itself. Fixed size for a given model and quantization.
- KV cache: the model's short-term memory of your conversation. It grows as the context grows.
- Compute buffers: scratch space the runtime needs while it works.
When people say "the model doesn't fit", they often mean the weights fit but the cache you asked for on top didn't. That distinction decides the fix, and it is exactly what an ordinary monitor hides.
Pick your case
What do you see?
Choose an option to see the answer
Fails right at load
The weights alone, or weights plus the cache for your context length, are bigger than free VRAM. Pick a smaller quantization or a smaller model, or shorten the context.
Loads, then slows after you raised the context
Most likely the KV cache grew and part of the work no longer fits in VRAM; the process view and the split will confirm it. Lower the context length first; it is the cheapest knob.
Worked before, fails now
Another process took VRAM: a game, a browser with hardware acceleration, a second model server. Look at the per-process view before touching the model.
Install gputaskman and look per process#
The README lists three ways in: a portable Windows ZIP, a clone run with uv run -, or pip inside a Python 3.11+ virtual environment. Platforms, as the README describes them:
- Windows 10/11 64-bit with an NVIDIA or AMD GPU (x64 and ARM64 ZIPs on the Releases page);
- Linux and WSL with an NVIDIA GPU (glibc 2.35+; WSL can read Windows host counters);
- macOS on Apple Silicon only from a source clone, no portable build.
The Windows ZIPs are unsigned. Download them only from the Releases page of the official repository, github.com/shanselman/gputaskman. Copy exact commands from the README: the project is young and options may change.
Once it's running, two views matter for this problem:
- Device view: VRAM use, GPU activity, PCIe, temperature, power, clocks and history charts. Good for "did something spike?"
- Process view: local GPU memory per process, GPU-accessible system RAM, engine activity and the detected runtime (CUDA, HIP, Vulkan, Direct3D, ggml, ONNX Runtime).
In the process view, find your model server (for Ollama, its bundled runner). Then check the rest of the list. If a browser or a game holds a few gigabytes, you've found your answer without touching the model.
Weights, KV cache, buffers: where the numbers come from#
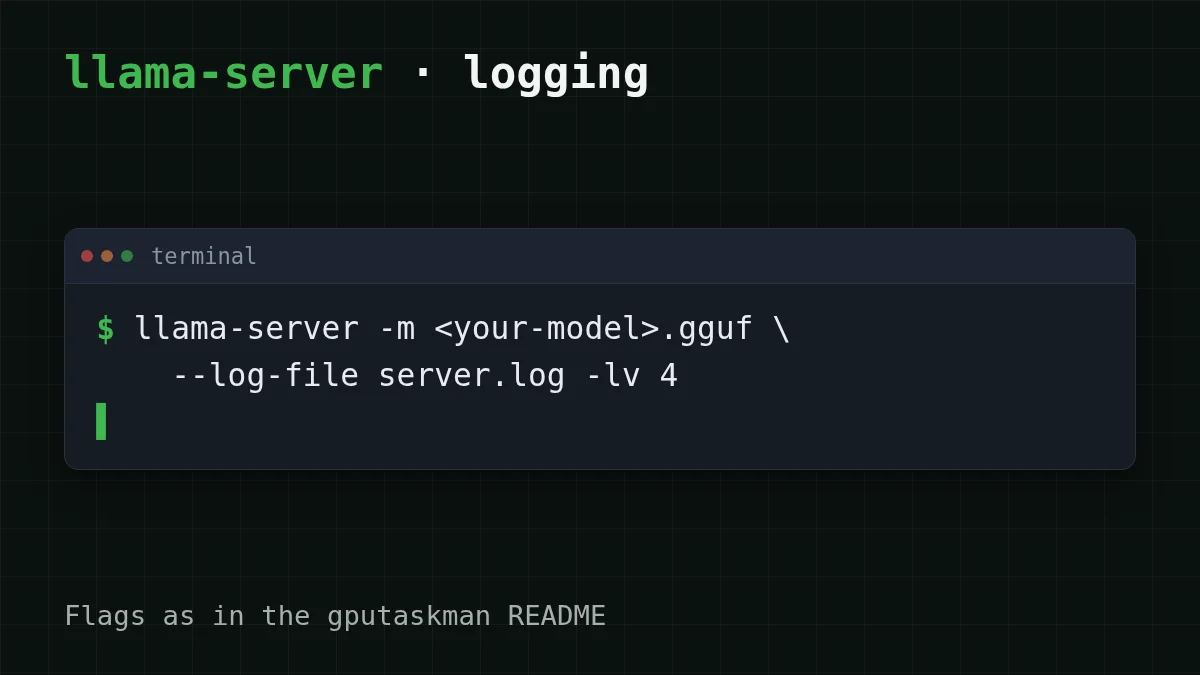
The model inspector shows architecture, quantization and buffer sizes where available. One caveat matters: per the README, weights, KV cache and compute buffers come from the runtime's load logs when compatible logging is enabled. For llama.cpp, start your own llama-server with logging (-; the README says level 4 is needed for buffer sizes). For Ollama, gputaskman uses Ollama's server.log if it is available. Otherwise they are estimates from GGUF metadata and context size, assuming llama.cpp-style placement. Per-model KV accounting inside a single process isn't supported yet.
So read an estimated split as "roughly", and a log-based split as "what the runtime reported". For Ollama the README says bundled runners are detected, GGUF blobs are named from Ollama's manifests, and server.log is used when available. LM Studio support is partial: models are named from its folder and probed via its local API, but this was tested with fixture responses, not end to end.
You can also save two snapshots as JSON and compare them with the diff command. That's a clean way to answer "what changed when I went from 4K to 16K context?": take one snapshot, change the setting, reload, take another.
Quick check
Your model loads but gets slow after you raise the context length. What should you check first?
Show answer
Answer: The KV cache
The weights don't change with context length; the KV cache does. Lowering the context length shrinks it right away.
Which knob to turn#
Reading the split gives you a decision, not just a picture.
Weights are the big slice. Move to a smaller quantization or a smaller model. This is the only lever that shrinks the weights. If you want the memory math behind it, see Can a 125B model run on a 16 GB GPU?
KV cache is the big slice. Shorten the context. In Ollama you can try it right in the session:
ollama run <your-model>
>>> /set parameter num_ctx 8192
8192 is only an example value; pick what your task really needs (command per Ollama's documentation, checked 5 November 2026).
If you later see strange slowness on prompt processing with a quantized cache in llama.cpp, this fix for the q5_1 KV cache is the next stop. For what a context window holds in the first place, read What is a context window?
Another process is the big slice. Close it, or run it on the integrated GPU. Nothing about the model needs to change.
Checklist
Before you blame the model
If it doesn't work#
- The split looks off. Check whether it's an estimate (no compatible load logs). With llama.cpp, run your llama-server with
-and reload the model. With Ollama, gputaskman uses- log- file server. log - lv 4 server.logif it exists; an estimate label is normal there. - LM Studio shows less detail. Support is partial, as above.
- No NVIDIA or AMD GPU. The tool covers local GPU workloads only; CPU-only, NPU-only and cloud workloads are out of scope.
- macOS. Run from a source clone; there's no portable build.
When a hosted model is the simpler fix#
Say you need a long context for one task, such as summarizing a big document, and your GPU only fits the model with a short one. You can keep tuning, or take the VRAM out of the picture. For tasks like that CheapTokens offers DeepSeek-V4-Flash: 380K context, up to 32,768 output tokens per answer, one price at any time of day, through an OpenAI-compatible API. GLM-5.3-Flash has a 390K context and up to 8,192 output tokens.
The call is the usual OpenAI format (put your key in an environment variable):
curl https://api.cheaptokens.dev/v1/chat/completions \
  -H "Authorization: Bearer $CHEAPTOKENS_API_KEY" \
  -H "Content-Type: application/json" \
  -d '{"model": "deepseek-ai/DeepSeek-V4-Flash-0731", "messages": [{"role": "user", "content": "Summarize this document: ..."}]}'
Setup details are in the docs. A rule of thumb for deciding: if a task keeps needing more context or a bigger model than your card holds, and the process view shows your VRAM is already well used, send that task to the API and keep the small, quick jobs local. Run DeepSeek locally or use an API? goes deeper on the trade-off.
Say you summarize 100 big documents, each 60,000 input tokens and 1,000 output tokens (well inside the 380K window). Here is what it costs today:
| Model | Input $/1M | Output $/1M | Per request | 100 requests | OpenRouter, 100 requests |
|---|---|---|---|---|---|
| GLM-5.3-Flash | $0.02 | $0.04 | $0.0012 | $0.124 | $0.209 |
| DeepSeek-V4-Flash | $0.015 | $0.10 | $0.001 | $0.10 | $0.434 |
| MiniMax-M2.7 | $0.05 | $0.15 | $0.0032 | $0.315 | $3.78 |
60,000 input and 1,000 output tokens per request. Prices per 1M tokens are current and change together with our tariffs; the OpenRouter column shows reference prices for the same workload.
On those numbers, $0.001 per document is the live price for one such call, and in total, with input and output counted together, it comes in below OpenRouter.
Cost calculator
Your own batch: change the tokens and requests
Input tokens per request: 60,000 · Output tokens per request: 1,000 · Requests per day: 100
| Model | Per day | Per month |
|---|---|---|
| GLM-5.3-Flash$0.02$0.04 | $0.124 | $3.72 |
| DeepSeek-V4-Flash$0.015$0.10 | $0.10 | $3.00 |
| MiniMax-M2.7$0.05$0.15 | $0.315 | $9.45 |


